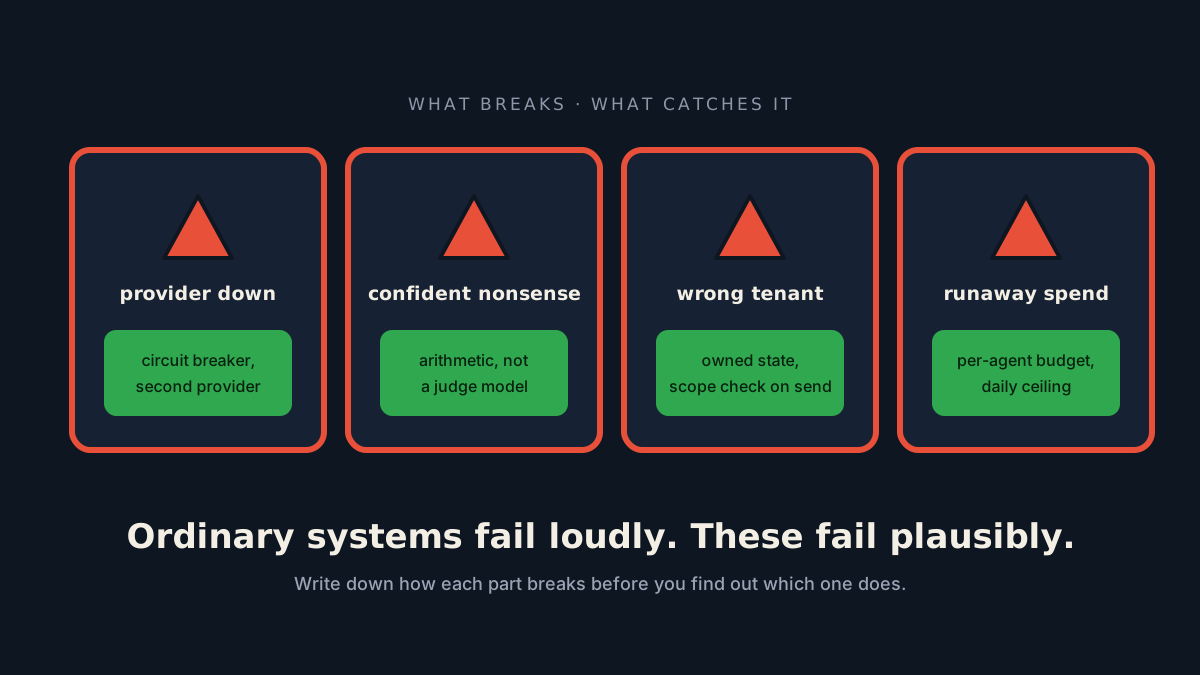
Ordinary systems fail loudly. These fail plausibly.
A language model system returns 200, the answer is fluent, every dashboard is green, and it is wrong. The four-column table that forces you to admit which failures you have no control for.
By Harrison ItotiaOct 6, 202610 min read
An ordinary service fails loudly. The request returns a 500, the error rate spikes, somebody gets paged, and within a minute a human knows something is wrong.
A system built around a language model fails differently. It returns a 200. The answer is fluent, confident and well-formatted. Every dashboard is green. The failure is discovered when a customer mentions it, possibly weeks later.
That difference is why these systems need an artifact that most teams never produce: a written list of the ways they can be wrong.
The artifact
It's a table, and it's deliberately boring. Four columns: the component, how it fails, what the user experiences, and the control that catches it.
Writing it takes an afternoon. Its value is not the document — it's that filling in the fourth column forces you to admit which rows have nothing in them.
Here's ours, trimmed to the rows that matter most.
| What fails | How it shows up | What catches it |
|---|---|---|
| The model provider is down or slow | Requests hang, then pile up across the system | Timeouts, a circuit breaker, and a second provider behind the same interface |
| The model invents something | A confident answer with no basis in your documents | Answers must cite retrieved material; unsupported claims are refused rather than shown |
| The model stops saying anything | Fluent, repetitive, empty text | Arithmetic on the output, not a reviewing model |
| Retrieval finds nothing useful | A plausible answer assembled from irrelevant passages | A relevance floor, and saying "I don't have that" rather than answering anyway |
| One tenant's data reaches another | Nothing. No error, no denial, no alert | State owned by key, plus a scope check immediately before anything is sent |
| Spend runs away | A normal-looking week and an abnormal invoice | Per-agent budgets and a daily ceiling enforced before the call |
| Something it read tells it what to do | The agent takes an action nobody asked for | Consequential actions pause once untrusted content has entered the turn |
Each of those third-column entries is a decision we've written about: a provider-independent boundary, arithmetic instead of a judge model, state that has an owner, budgets enforced before the call, and designs that survive injection.
The table is what makes them a system rather than a collection of good ideas.
The row that teaches you the most
Look again at the tenant row. Its "how it shows up" column says nothing.
That's the defining property of this class of system, and it's why the exercise is worth doing. Ordinary reliability work assumes failures announce themselves and the job is responding quickly. Here, several of the worst outcomes produce no signal at all — so the control has to be structural, because there's no alert to build.
When you fill in the table honestly, the rows where the middle column reads "nothing" are the ones that deserve the engineering.
The measurements that don't exist in normal monitoring
Your existing tools cover latency, errors and saturation. None of them has an opinion about whether an answer was any good. Four extra signals carry most of the weight.
Grounding. What proportion of answers are actually supported by the material retrieved for them? A drop usually means retrieval degraded — new documents, a changed index — long before anyone reports a wrong answer.
Escalation rate. How often the agent hands off to a person. It's the cleanest single indicator of whether the thing is working, and it moves before complaints do.
Cost per completed task. Not per request. A rise here with flat traffic means something is retrying, looping, or quietly reaching for a more expensive path.
Time to first token, separately from total time. They fail independently, and watching only one hides a system degrading behind a comfortable façade.
Add one more that isn't a model metric at all: cache hit rate. A sudden drop means everyone is falling through to the slow, expensive path, and it's usually the earliest warning you get that something upstream changed.
Why it's worth writing down
Three reasons, in ascending order of how much they matter.
It shortens security reviews. "How do you handle hallucination?" has a row, with a control, rather than a paragraph of reassurance.
It survives people leaving. The reason a check exists is rarely obvious from the code. A table that says which failure it was built for keeps the next engineer from removing it as dead weight.
It forces the question nobody asks. Filling in the fourth column means asking, of every control you already have, what is this blind to? That's the question that would have saved us from a broken document that three checks called clean — our strongest check examined numbers, and that failure contained none.
Do it before you need it
The natural time to write this is after an incident, when the failure is vivid and the fix is obvious. That's also the most expensive time, because the first row got written by a customer.
An afternoon with your team and four columns will find two or three rows where the last column is empty. Those are the next things to build — and you'll have found them by thinking rather than by being told.
Green dashboards mean your system is running. They have never meant it is right.
Thinking about an agent like this for your team?
Describe the job you want automated and our Automation Architect blueprints it in seconds — or talk it through with the engineers who ship them.